Interactive Exploration and Analysis#
As the size and dimensionality of datasets increases, it becomes critical that a scientist be able to interactively view the data in order to understand how to ground further analysis. Unfortunately, increasing dimensionality and dataset size also makes interactivity a harder technical problem. This aspect of data analysis, especially as manifested in ImageTool, has been among greatest strengths of the ARPES community.
PyARPES solves the interactivity problem by offering two sets of tools in two different environments, depending on what a given user prefers.
QtTool or
qt_tool, an ImageTool-like native data exploration client for 2, 3, and 4 dimensional data exploration and visualization
Furthermore, we discuss below how these interactive tools get around one of the most annoying sticking points of Jupyter notebooks, the problem of lost work through kernel restarts and hanged kernels, by being restartable even across different notebooks.
Using dyn_tool.dyn you can even make (almost) any function
interactive. This is an excellent technique for choosing good parameters
or testing a new analysis function.
QtTool#
Should be relatively straightforward to use. This is very new so it should be improving rapidly, current quirks include:
No in-tool transposing
Color normalization does not persist across scrolling
Ultimately we aim to include most of the behavior from ImageTool 5 as well as a few other tools (like marking symmetry points) that are especially helpful in PyARPES.
Invoke with qt_tool
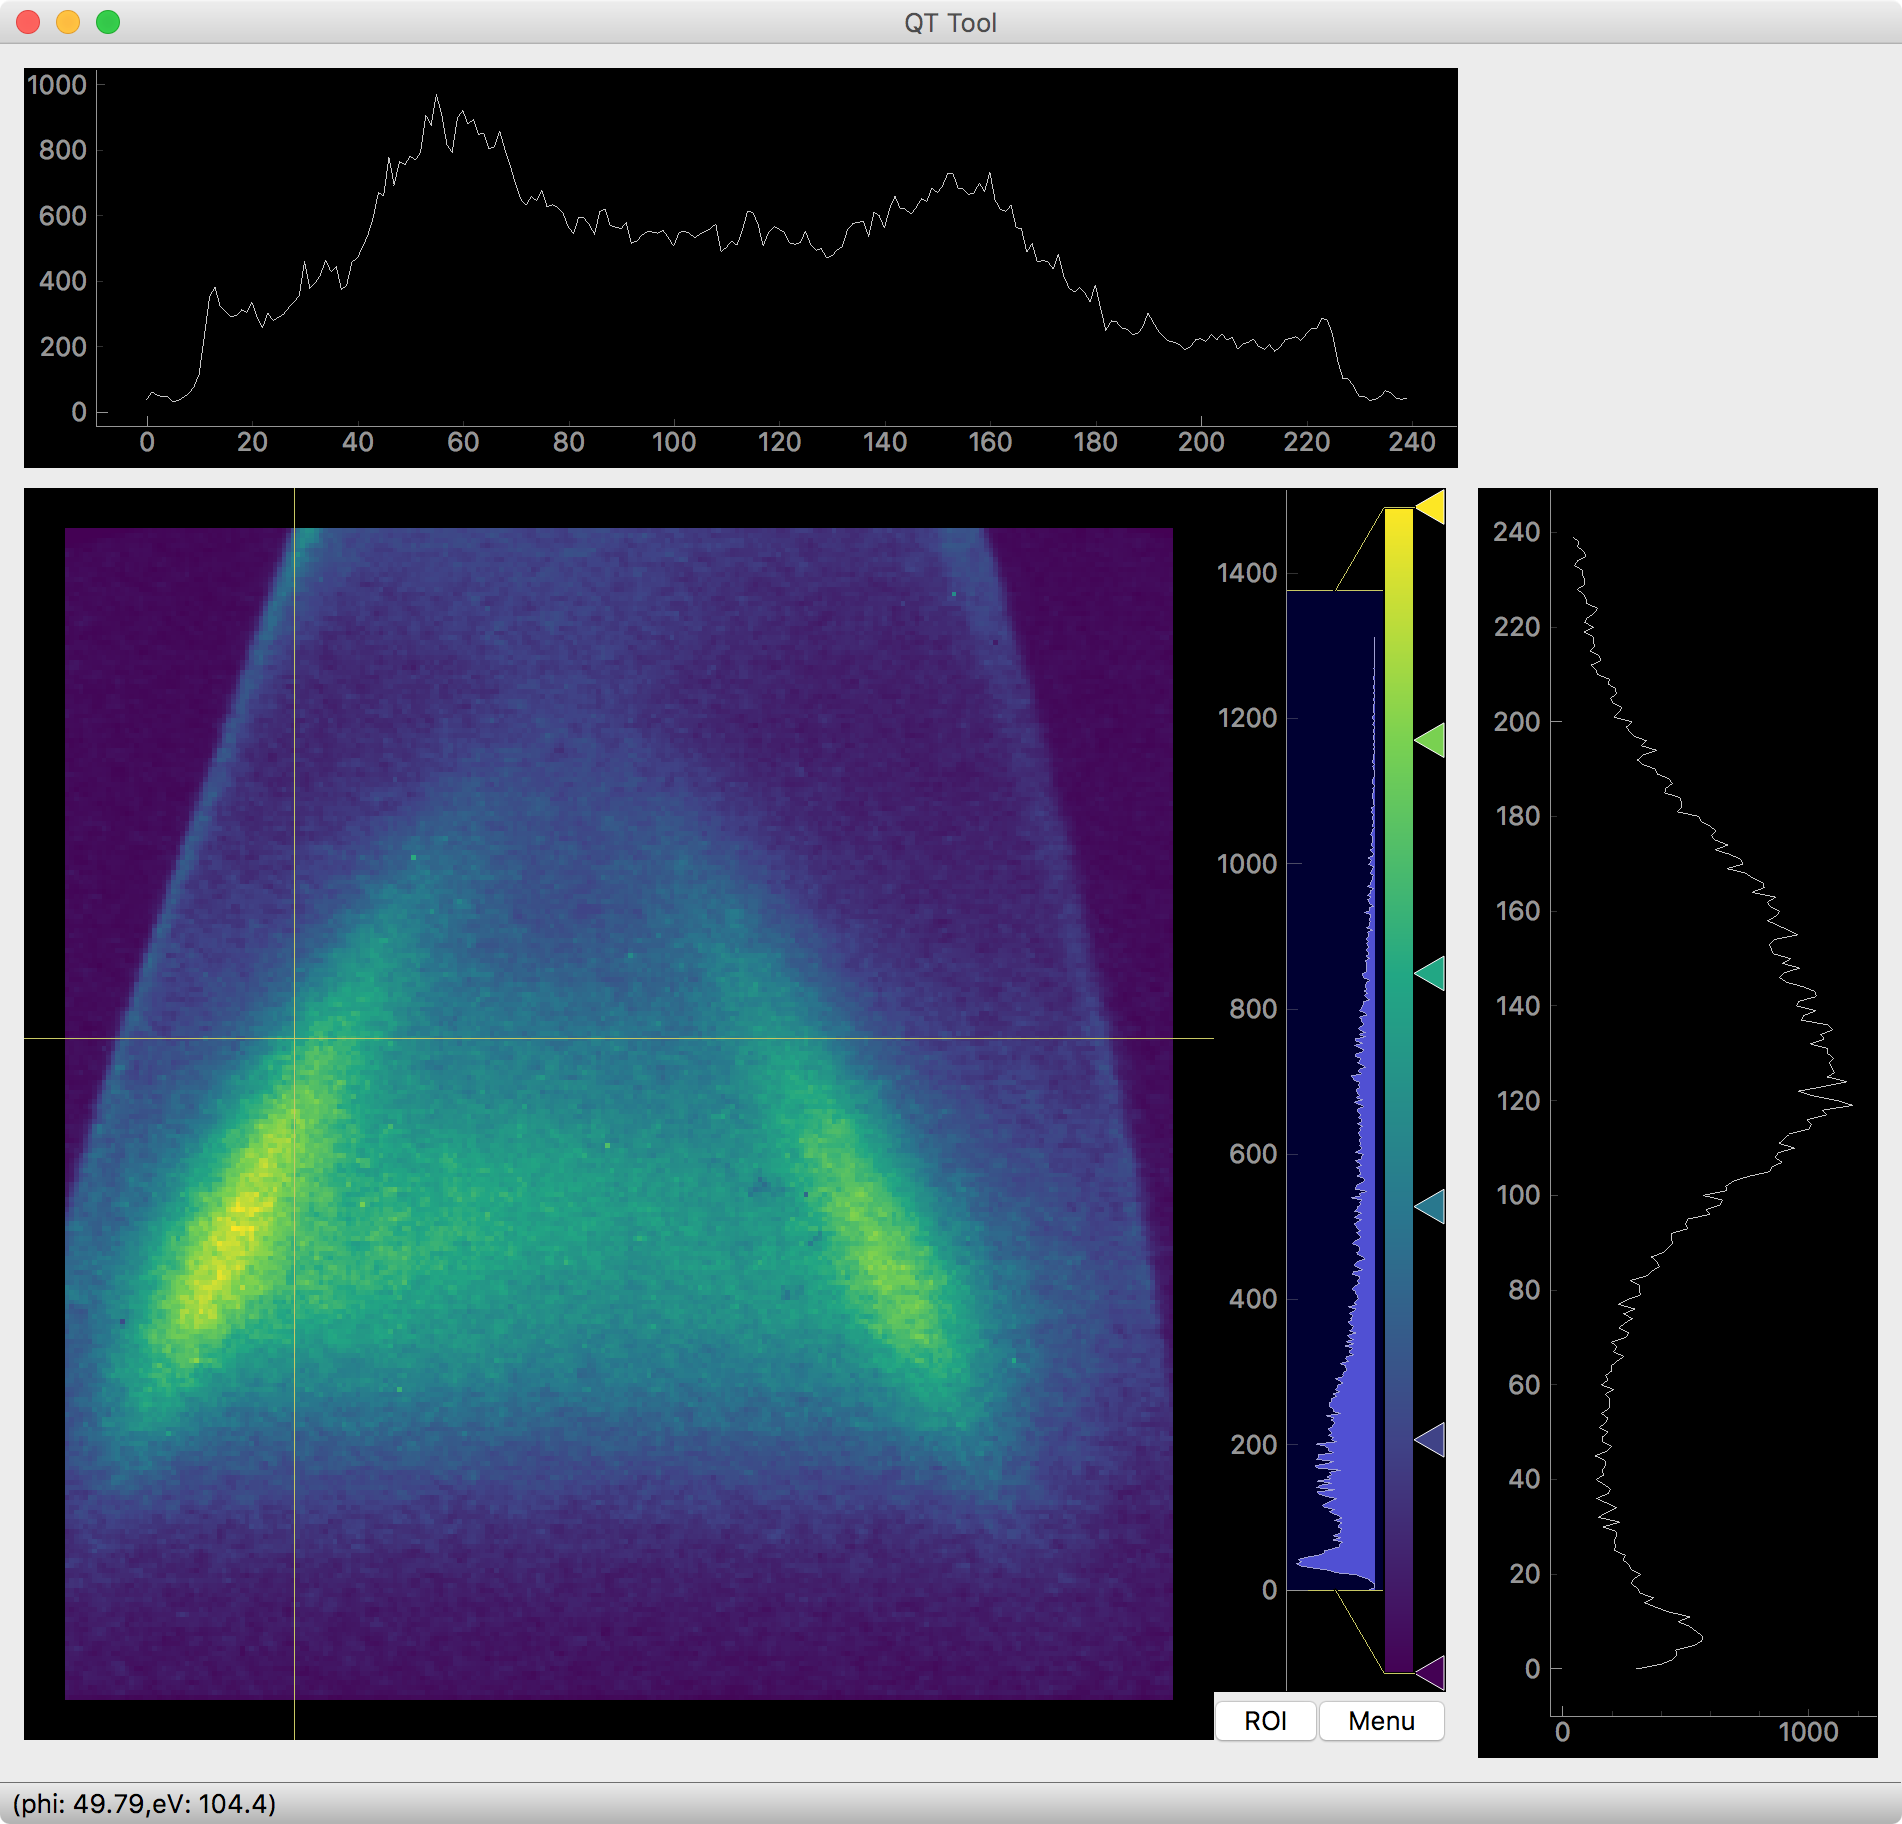
QT Tool#
Masking#
You can use mask() to get an interactive masking utility. See
here for more details.
Laying Lineshapes for Curve Fitting#
Use .S.show_band_tool() to get an interactive lineshape/band layer
to set initial locations and model structure for complicated curve fits.
Examining Fits#
Use .F.show() to get a tool that allows
interactively examining curve fit quality.
Making Any Function Interactive#
One of the advantages of using a dynamic language for scientific data analysis is that new interactive tools can be built very simply. Additionally, it is possible to build tools that allow you to make an arbitrary analysis interactive.
Here, we will turn arpes.analysis.filters.savitzky_golay, a
popular 1D and 2D filter used sometimes in ARPES for smoothing data into
an interactive tool, allowing us to choose good values for the two
filter parameters. Because the extra filter parameters window_size
and order are not marked as integer, we will have to tell dyn
their type.
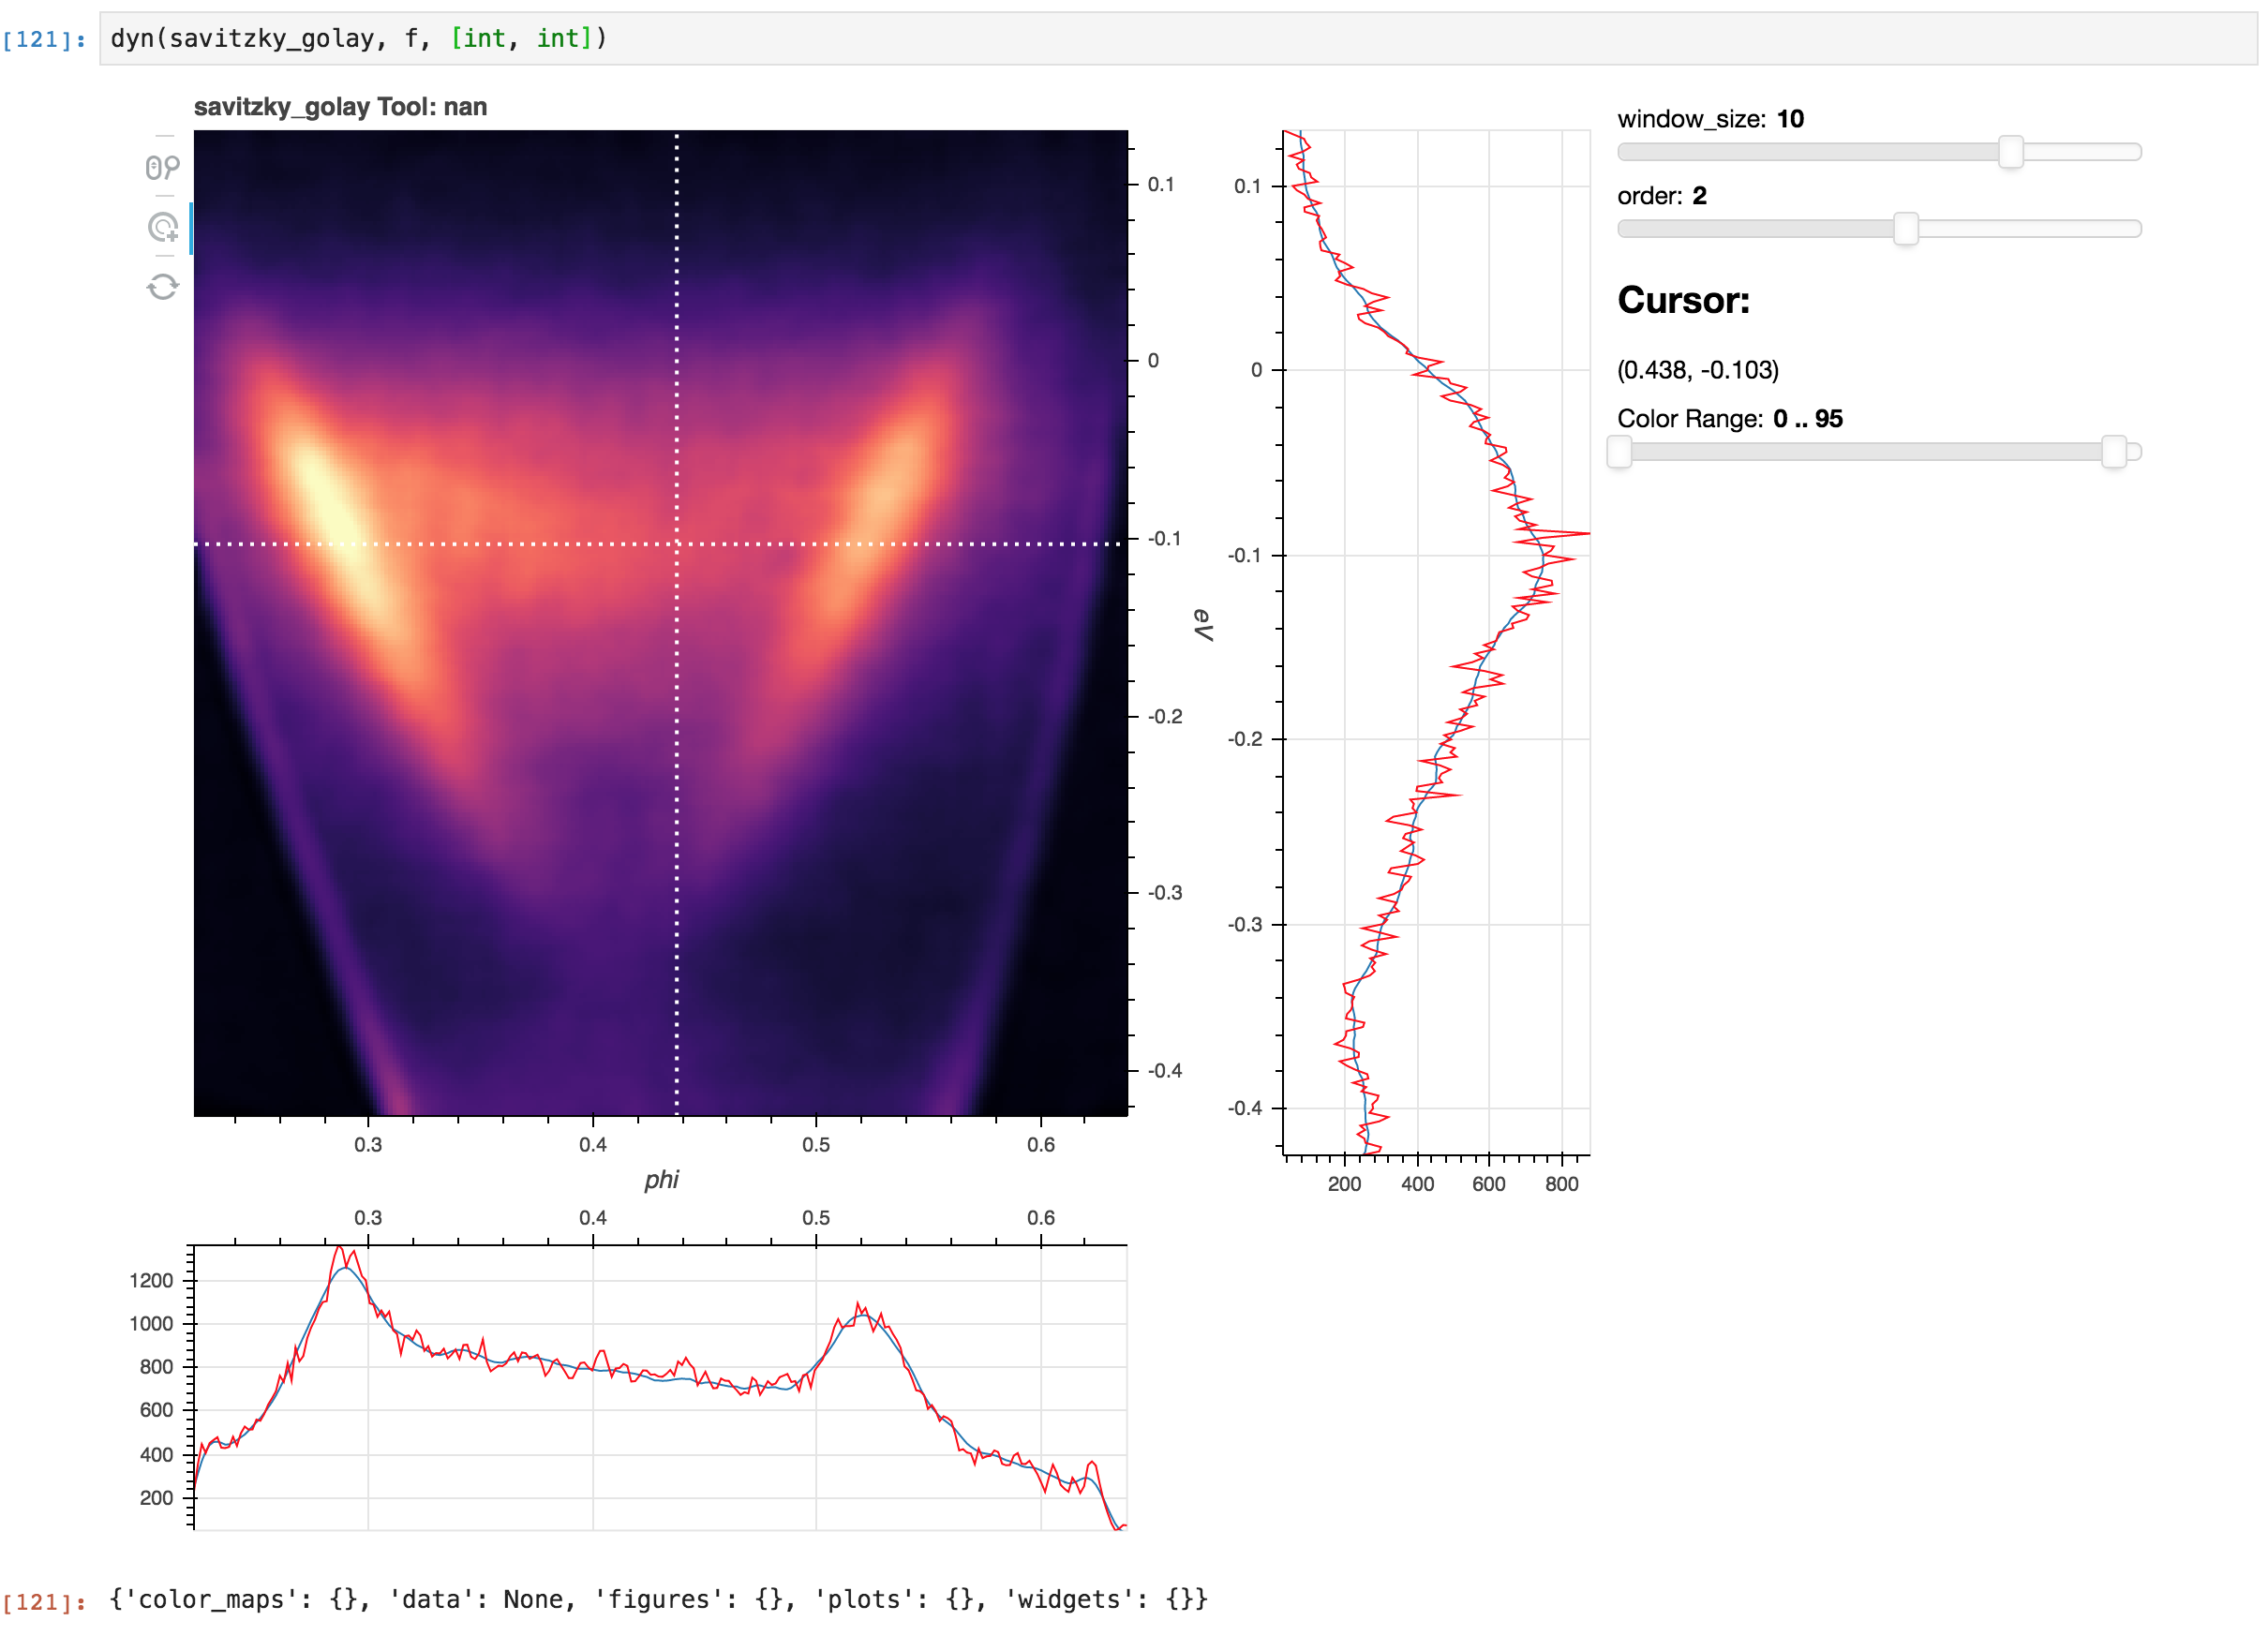
Making a dynamic Savitzky-Golay filter#
In the marginals, the red data is raw while blue indicates the result of applying the function with the values selected by the sliders. The image data is the full filtered dataset.