TARPES analysis#
note#
As the real tarpes data is really larlge (making it impractical to include this package), so here we create a mock Xarray resembling the data and use it for explanation.
The mock data is a list that contains xarray:
1000 xarray objects. Each xarray represents the single set at a certain position of the delay line.
20 x 20 matrix data
Angle (-10deg to 10deg) and energy (5 eV to 6eV)
“position” attributes, for the delay line positilon (100.0mm to 103.00 mm), which is converted to delay time.
[1]:
import numpy as np
import xarray as xr
from scipy.special import erf
import matplotlib.pyplot as plt
from numpy.typing import NDArray
from matplotlib import animation
from matplotlib.collections import QuadMesh

import arpes
from arpes.io import example_data
from arpes.plotting.movie import plot_movie, plot_movie_and_evolution
Activating auto-logging. Current session state plus future input saved.
Filename       : logs/unnamed_2026-03-24_23-29-21.log
Mode           : backup
Output logging : False
Raw input log  : False
Timestamping   : False
State          : active
[2]:
mock_tarpes = example_data.t_arpes
tarpes analysis#
find_t_for_max_intensity#
[3]:
tarpes_ = arpes.analysis.build_crosscorrelation(
    mock_tarpes, delayline_dim="position", delayline_origin=100.31
)
[4]:
arpes.analysis.find_t_for_max_intensity(tarpes_)
[4]:
1021.2881894592429
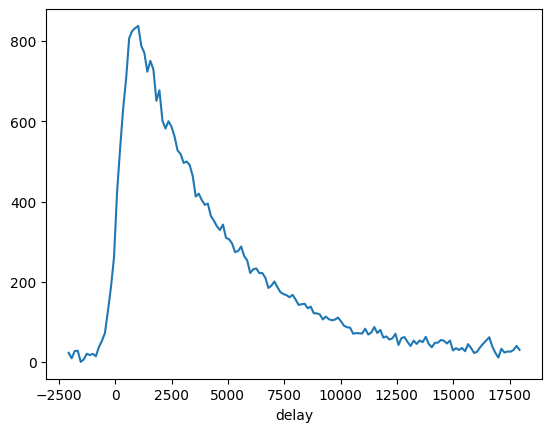
[5]:
sum_dims = set(tarpes_.dims)
sum_dims.remove("delay")
sum_dims.remove("eV")
summed = tarpes_.sum(list(sum_dims)).sel(eV=slice(None, None)).mean("eV")
summed.plot()
[5]:
[<matplotlib.lines.Line2D at 0x719af66c1c40>]
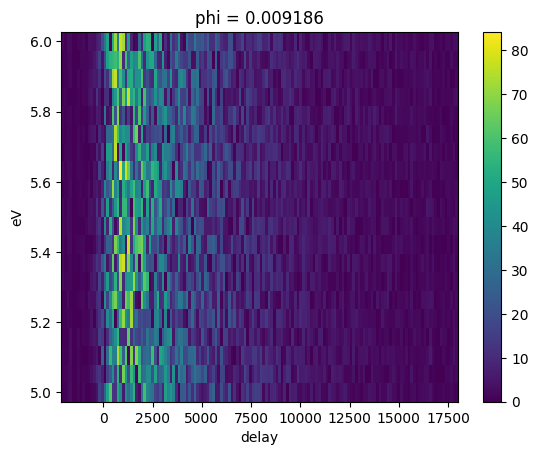
At a certain angle (here phi \(\sim\) 0), the temporal evolution shows as follows:
[6]:
tarpes_.transpose("eV", ...).sel({"phi": 0}, method="nearest").S.plot()
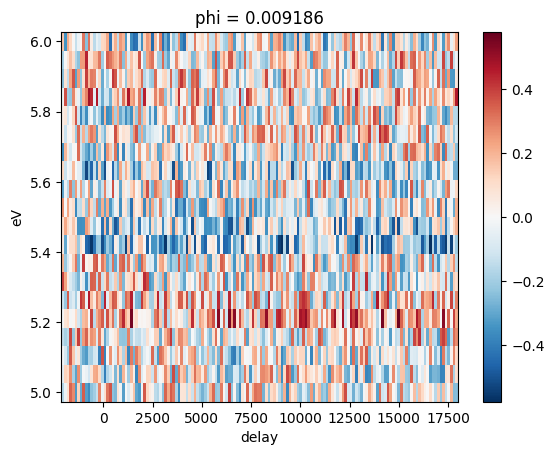
relative_change#
[7]:
relative_ = arpes.analysis.relative_change(tarpes_)
relative_.transpose("eV", ...).sel({"phi": 0}, method="nearest").S.plot()
Animation#
Two styles are provieded. (plot_movie, and plot_movie_and_evolution)
Most of options are same. See the documents.
[8]:
plot_movie(tarpes_.transpose("eV", ...), figsize=(6, 3.5))
[8]:
[9]:
plot_movie_and_evolution(
    tarpes_.transpose("eV", ...), evolution_at=("phi", (0, 1)), figsize=(6, 3.5)
)
[9]: